Unit 10 & 11: Graphing & Probability
SOL 3.14 The student will investigate and describe the concept of probability as a measurement of chance
and list possible outcomes for a single event.
SOL 3.15 The student will:
a) collect, organize, and represent data in pictographs or bar graphs; and
b) read and interpret data represented in pictographs and bar graphs.
and list possible outcomes for a single event.
SOL 3.15 The student will:
a) collect, organize, and represent data in pictographs or bar graphs; and
b) read and interpret data represented in pictographs and bar graphs.
Online Tools:Bar Graphs
Link to the lesson: Click here This Study Jams lesson (powered by Scholastic) includes a video and quiz. Pictographs
Link to the lesson: Click here This Study Jams lesson (powered by Scholastic) includes step-by-step instructions and quiz. Choosing the Correct Graph
Link to the lesson: Click here This Study Jams lesson (powered by Scholastic) includes step-by-step instructions and quiz. Finding Probability
Link to the lesson: Click here This Study Jams lesson (powered by Scholastic) includes step-by-step instructions and quiz. |
Study Materials: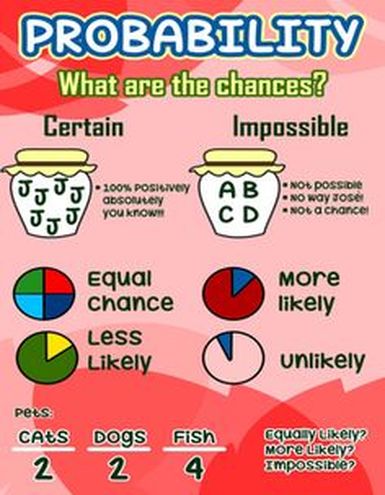
|
